The El Niño phenomenon, which developed this summer, is projected to intensify significantly, potentially becoming one of the strongest ever recorded. Its cascading effects are expected to influence global weather patterns throughout the remainder of this year and into 2027, representing an extraordinary amount of ocean warming due to the vast energy required to raise ocean temperatures.
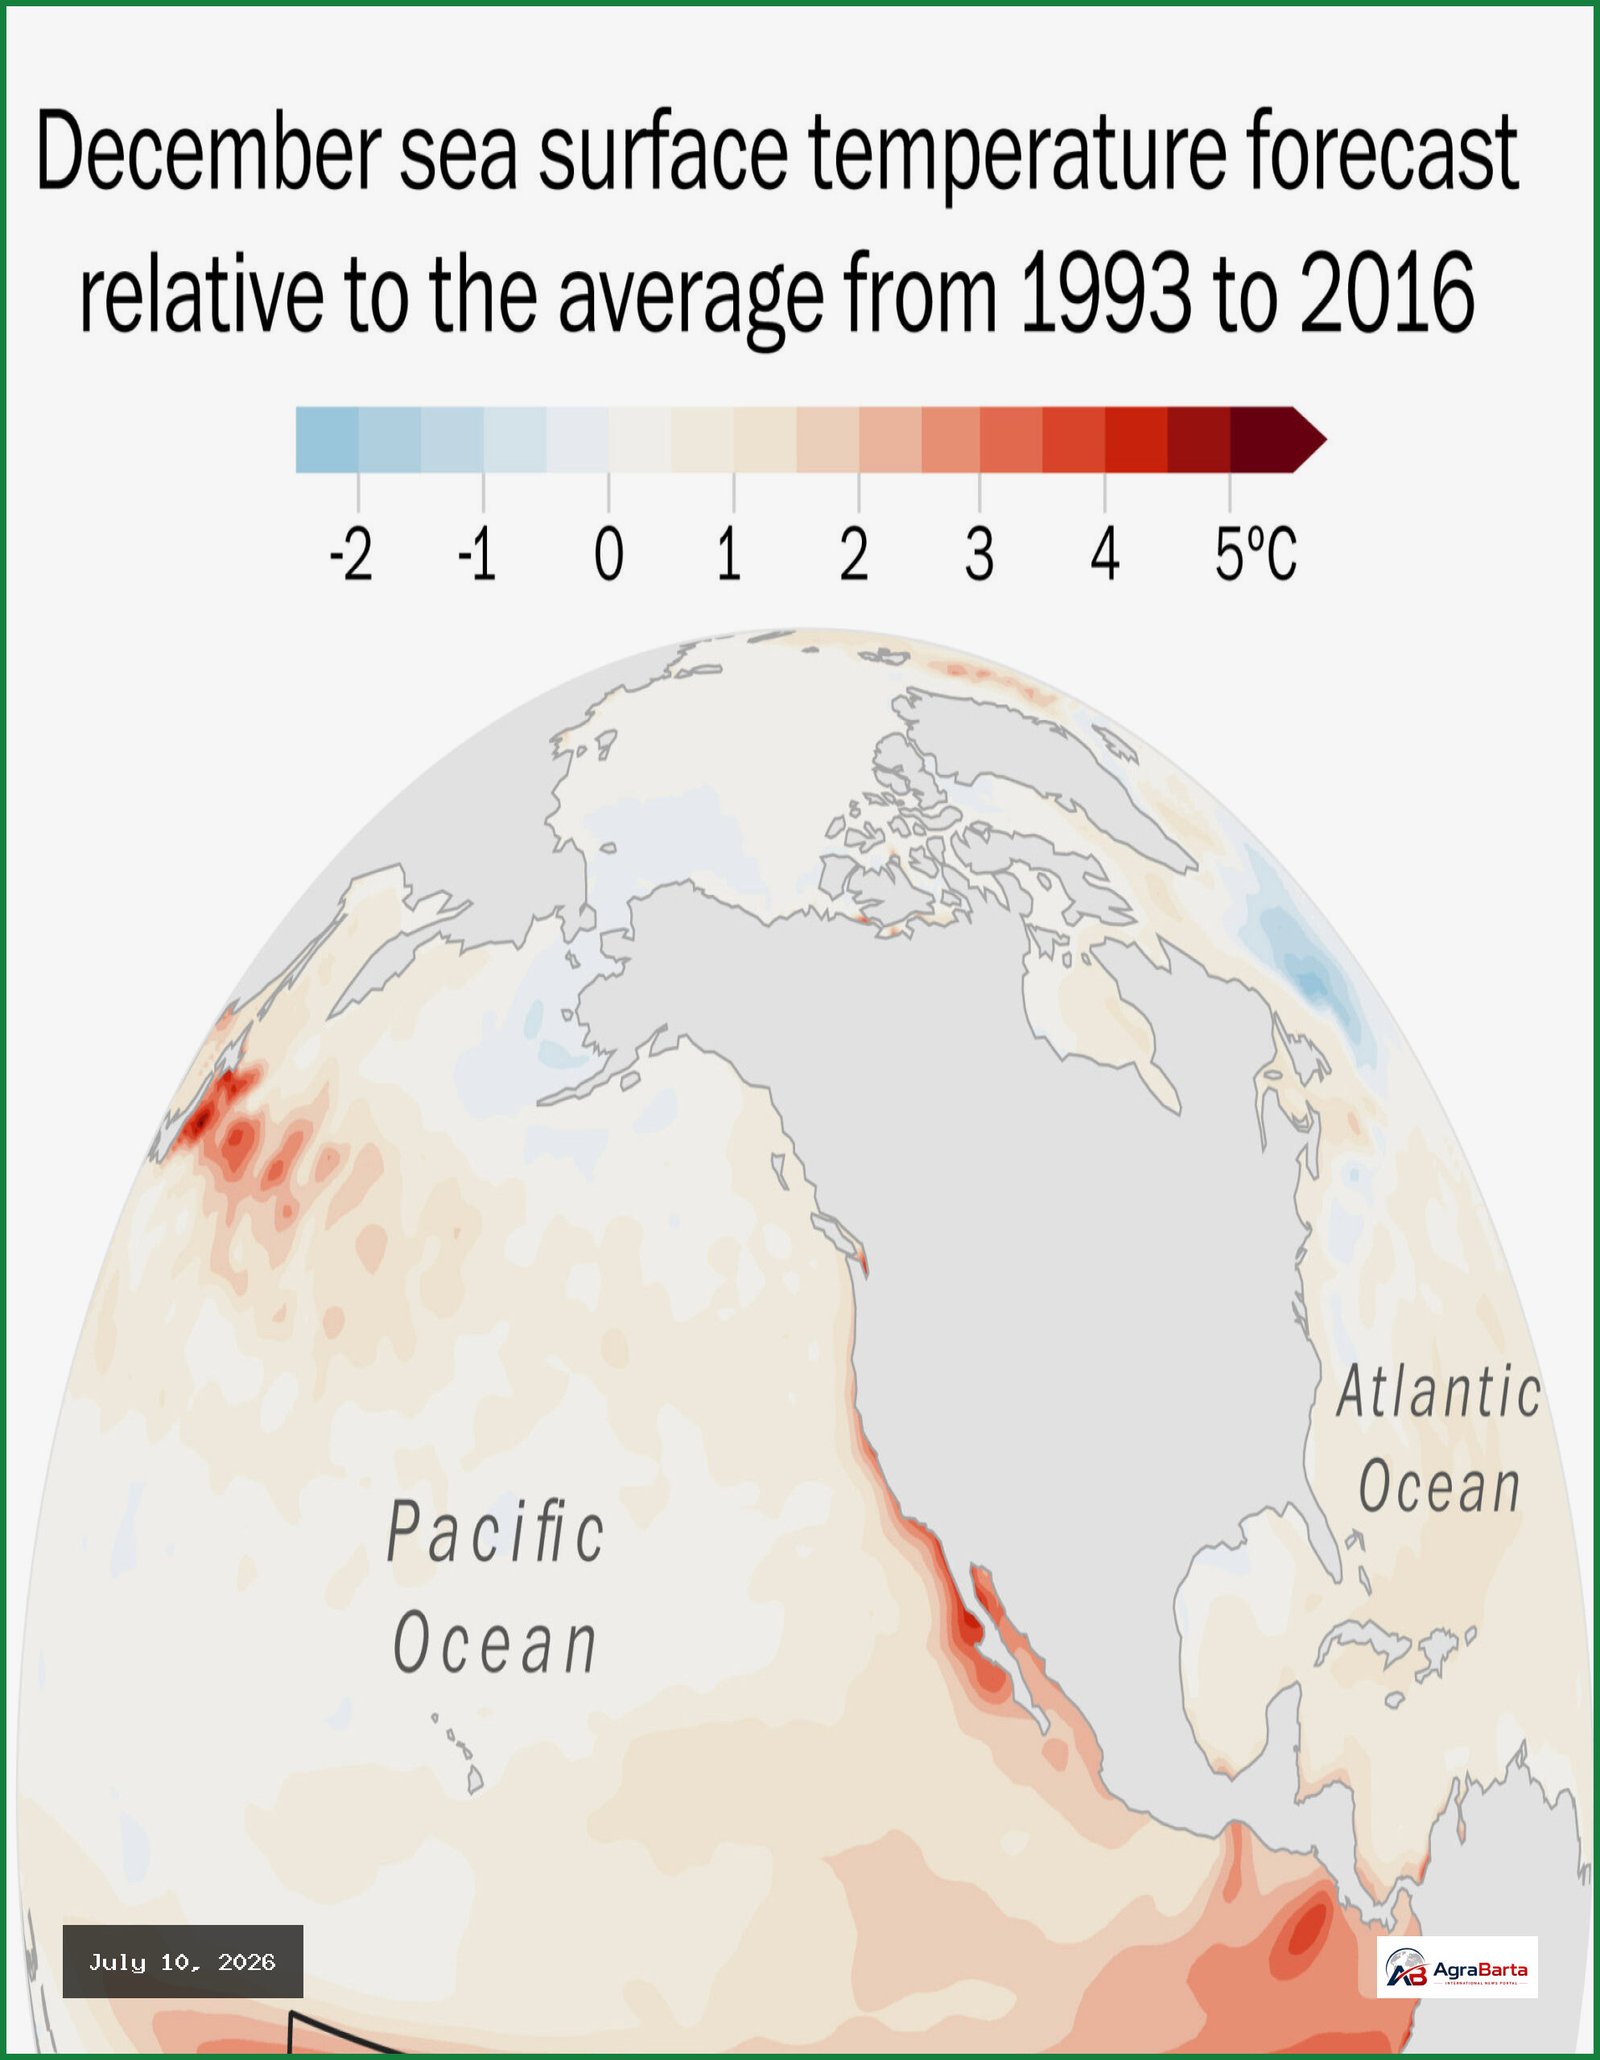
Current sea surface temperature forecasts suggest this El Niño could surpass historically intense events, possibly by a wide margin. Previous major El Niño occurrences include 1877-78, 1888-89, 1972-73, 1982-83, 1997-98, and 2015-16. Forecast scenarios, represented in tracking graphics, show ocean temperatures reaching unprecedented heights by the end of the year.
El Niño is a natural warming of ocean waters in the eastern and central equatorial Pacific, typically occurring every two to seven years. This current phase was initiated by a wind burst in the remote western Pacific in December. Subsequent wind bursts continued to form, shifting large quantities of warm water from west to east across the Pacific via oceanic features known as Kelvin waves. This process notably led to summerlike weather in Peru during its winter season.
The warmer seas in this remote region alter thunderstorm patterns, which then transfer heat from the ocean to the atmosphere, creating a ripple effect on weather patterns across the globe. These shifts in thunderstorm activity cause the jet streams—storm-carrying ribbons of wind in the upper atmosphere—to change speed and direction, further impacting weather worldwide.
An El Niño of this magnitude is anticipated to drive significant and potentially longer-lasting weather impacts. Global temperatures could reach new record highs, with more than an 80 percent chance that 2027 will become the warmest year on record. This is because warmth accumulated along the equator in the Pacific Ocean is released into the atmosphere and disseminated globally.
For the period through September, approximately 2.8 billion people globally face at least a 10 percent chance of experiencing temperatures within the top 5 percent of historical values for this time of year. Regions particularly susceptible to unusually high temperatures include the Caribbean, Central America, northern South America, the Middle East, India, Indonesia, and some Pacific Island nations.
Changes in atmospheric circulation, driven by El Niño shifting and strengthening high and low-pressure cells, also increase the risk of drought in some areas and extreme rainfall in others. Around 1.4 billion people live in areas with at least a 10 percent chance of much less precipitation than normal through September. These include Central America, parts of the Caribbean, northern and western South America, parts of Northern and Western Europe, northeastern Africa, swaths of the Middle East, India, Indonesia, and some South Pacific islands.
Conversely, about 757 million people reside in areas with at least a 10 percent chance of excessive precipitation, which could lead to flooding. These regions include large parts of South America (such as Peru, Ecuador, Chile, Bolivia, and southern Brazil), areas near the Mediterranean Sea (including southern Europe and northern Africa), and pockets of southern Asia from India to Thailand, as well as Kiribati, Guam, and the Northern Mariana Islands in the Pacific Ocean.
El Niño is also expected to contribute to much higher humidity than normal in some regions, such as the Intermountain West, where a more robust monsoon pattern is anticipated this summer, and near the Gulf Coast. Europe may also experience higher humidity, exacerbated by marine heat waves in coastal waters due to frequent heat domes.
While El Niño is a crucial factor in global weather, it is not the sole driver. These predictions incorporate various climate-influencing factors, and seasonal outlooks are generally most accurate near the tropics. These outlooks don’t predict specific weather events. Instead, they show where unusually extreme climate conditions are more likely, often because of frequent storms or persistent departures from normal weather patterns. The patterns of unusual weather can shift with each forecast update; for instance, impacts across the U.S. typically peak during winter, bringing heavy rain to the West, South, and East.
Ocean temperatures are generally rising, largely due to climate change, including in the key region where El Niño is measured. To differentiate El Niño-induced warming from long-term ocean warming, scientists have developed a new climate change-adjusted index. Rather than looking only at temperatures compared with the average in the central equatorial Pacific, this index, now utilized by the National Oceanic and Atmospheric Administration (NOAA) and climate agencies in Europe, Australia, and New Zealand, compares temperatures in the central equatorial Pacific with the average temperature across all tropical oceans. In other words, it measures how much warmer the El Niño region is than the rest of the tropics. This relative temperature difference is closely linked to shifts in tropical thunderstorm activity, which in turn drives El Niño’s global weather changes. Even a slight increase in warming enhances the atmosphere’s moisture-carrying capacity, with air holding approximately 4 percent more water vapor for every degree Fahrenheit of warming, potentially amplifying precipitation extremes worldwide.
Climate data for this report comes from the Copernicus Climate Change Service, using the ECMWF model for predictions and the ERA5 atmospheric reanalysis for historical comparisons. Sea surface temperature forecasts for the current El Niño are benchmarked against retrospective forecasts from 1993 to 2016, known as hindcasts, to identify unusually warm or cool conditions. Maps illustrating potential weather extremes show probabilities of temperatures, precipitation, and humidity exceeding the 95th percentile or falling below the 5th percentile, based on hindcast data from 1981 to 2025. New forecast information is released monthly after the 6th, looking one month further into the future, while the chart comparing this El Niño with past events is updated more frequently.